How to set Google Ads Benchmarks is a topic we’re frequently asked about. And while we’d love to scratch it all out in a sentence or two, the truth is that it requires a bit more explaining – so, we decided to write a blog post about it. In this post, we’ve provided a tried and tested set of considerations that will underpin a solid benchmark for all the key metrics, including:
- CPM – how many people you should reach with a given spend.
- CPC – what it should cost to get one person to click through to your website.
- CTR – the rate at which people arrive at your site, as compared to how many people have seen your ad.
- CPA – the cost to make an ‘acquisition’, which could be a sale, a newsletter signup, a lead, or a video view (i.e., whatever goal was set).
So off you go – grab yourself a tea or coffee – then settle in, while we tell you all about benchmarks for Google Ads.
Does a Google Ads Benchmark already exist? (or in other words, can’t I just use someone else’s?)
The short answer is yes, and no. A company called WordStream has published Google Ads Benchmarks for many industries. They come up first in the search engine results pages (or SERPs) when you’re Googling for information, and for several good reasons. First is that WordStream know a thing or two about SEO, second is that every blog post and its dog throws them a backlink, and third is that they’re the only company that really has the breadth of data over time (besides Google itself) to provide something that’s statistically reliable.
While their data can be a good reference point, it does come with some caveats.
- WordStream’s Google Ads Benchmarks are compiled using data gathered only in the USA.
- The data applies largely to consumer brands, not B2B brands.
- The data is gathered from ~ 1,200 of WordStream’s clients.
As you can probably see, it would be difficult for an Australian marketer with a B2B focus to rely on these stats with confidence. So as tempting as it is to dust off your hands and yell, “WOOT, I’m off to watch some Netflix”, your job is not really done.
How then should you come to your own set of reliable (and realistic) Google Ads benchmarks?
First up: what to benchmark against
Simply put, pay-per-click (PPC) benchmarking (no matter the channel) puts a line in the sand that helps ensure your campaigns are always improving against a standard. The first step in the process, therefore, is to decide what standard to benchmark your Google Ads performance against. There are in fact several that need to be considered:
- Past performance benchmarking
- External benchmarking
- Benchmarking against other channels
- Return On Ad Spend (ROAS)
Past-performance benchmarking
This one’s the no-brainer and it’s the key in determining the baseline set of metrics from which to measure performance for your company and your products. If you’re new in your job, it’s also a chance to show up your predecessor!
Simply select the Google Ads performance stats you want to track and look at the past performance of each campaign that you’ve been running. It’s important that you do this for each campaign, rather than all your campaigns together, because there are some that you can’t compare – for instance if you’re running a Google Search campaign, performance of your branded search terms is going to be very different from your non-branded search terms. Likewise, remarketing is going to be different to running a cold campaign.
Bear in mind also that there are factors that influence the consistency of these figures. These metrics will vary from month to month, and can be influenced by seasonality, other advertising activity, market influences (yep – COVID is one) and the activity of your competitors. Solid note-keeping against your data is important, as is collation of data over as great a time-period as possible.
If you’re just starting out with Google Ads, congratulations! You get to skip this step.
External benchmarking
This is the point at which the WordStream data on Google Ads benchmarks can be factored in as a component. You should also factor in as much other third-party data as you can get your hands on. Research from companies like Smart Insights, eMarketer, comScore, Forrester and the Internet Advertising Bureau can yield general insights for your industry and for other businesses that are run in the same way as yours. They can help you track year on year changes against broader benchmarks such as SEM vs SEO, desktop vs mobile, search vs display, etc.
Bear in mind that this is still general information, and usually based on global or US-based campaigns, so in order to get to that campaign-by-campaign level mentioned above, you’re going to need to draw on other insights to develop your Google Ads Benchmarks. This is where data from companies like Adthena or SEMRush can be useful. These products aren’t free and how to use them will need to be the subject of another blog post, but in short, delving into this data will allow you to gain insights on named competitors, across all types of paid online advertising, including Google Ads.
Of course, our team here at Splendid can also provide you with detailed and specific SEM insights which are based on actual data from the many thousands of campaigns we have executed for our technology B2B clients.
Another way to get into the nitty-gritty of external benchmarking is to go straight to the source – Google itself. If you’re running a Google Search campaign, Google’s Keyword Planning Tool allows you to look at key metrics for each of the keywords that you’re targeting in your campaigns. It will allow you to get a feel for what others are paying (CPM, CPC, CPA), and it estimates what your CTR could be, based on the parameters you’ve set for the campaign (such as the region that you’re in). These are very sensible numbers to use for Google Ads Benchmarks, but it’s important to note that they’re not guaranteed and won’t ensure that this is what you’ll achieve as well.
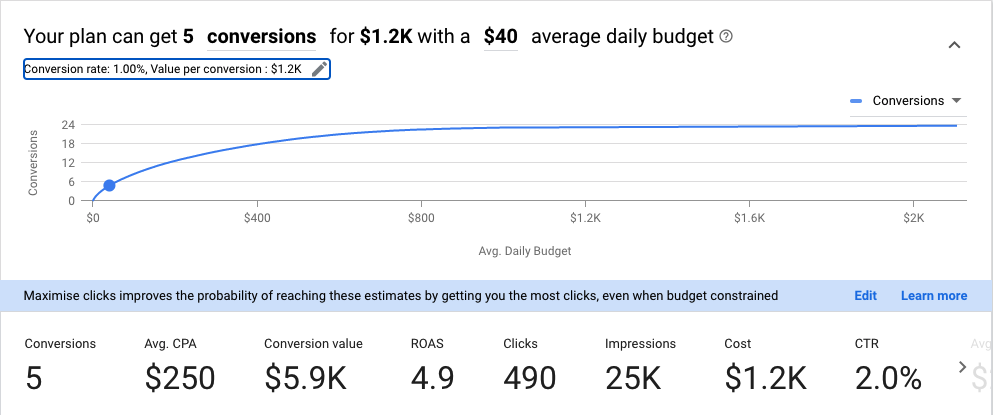
In addition to the keyword planning tool, Google provides bid simulators that allow you to plug in the numbers you’ve been playing with to estimate how your ads might perform. All you need to do is log in to your Google Ads account, and you’re away. There are excellent tutorials available on Google if you’re not sure how to get started.
Benchmarking against other channels
Another area of consideration that will help you develop a Google Ads benchmark is to take a very close look at all your other marketing channels and what results they’re giving you. There’s absolutely no point in sweating over improving your Google Ads performance if your SEO efforts or your LinkedIn campaigns are consistently kicking Google’s derrière with not much trouble.
This is where a little bit of dabbling in your Google analytics can really pay off. Getting into your acquisition reports and gaining a good understanding of ‘channel’, ‘source’ and ‘medium’ is essential, as is the establishment of appropriate goals and conversions. Attributing results to above the line media or digital publications and newsletters can be a little tricker, but with clever use of the right CTAs in your advertising, judicious use of data and time reporting, and UTM tags in things like eBooks and newsletters, you can still get a feel for these mediums as well.
Arriving at a benchmark for each of the key metrics for these mediums will require a bit of legwork, as you’ll have to put a value on the total cost of their production, but this is a good reminder that the total cost of your Google campaign’s creative and ongoing maintenance should also be factored in when you assess what return it’s giving you and you look to set a benchmark. Splendid can also help you with this. We have a commercial forecast modelling tool which enables us to create a consolidated ROI model across all the channels you are using in your campaign.
Return On Ad Spend (ROAS) as a Google Ads Benchmark
The last area of consideration in your Google Ads Benchmark odyssey is to take a close look at your return on ad spend, or ROAS. Not to be confused with ROI (which should really consider total operational costs and can be more challenging but not impossible to calculate) ROAS simply looks at the amount spent on the advertising component of your business costs. For this post, it’s the benchmark that rules them all.
Calculating ROAS makes you go beyond the basic CPC, CTR and CPM and forces you to assign a dollar value to a goal conversion. When you’re selling hand-knitted socks from your Shopify site, it’s a much simpler task than assigning a value to a lead who might acquire a cloud services package which doesn’t have a fixed cost. It’s worth working out, however, as it’s a number related directly to the bottom line.
To calculate the value of a lead, you’ll need to get into the figures from your CRM system to work out what percentage of leads from your website convert into sales, and then average out the dollar value of those sales across as long a period as you have data for. It’s not too hard:
Calculating the average website sale value from a lead:
Total revenue from leads that converted: $10,000
Total number of leads that converted: 10
Average website sale value from a lead: ($10,000/10) = $1,000
Conversion rate:
Leads generated: 100
Leads that convert to sales: 10
Conversion rate: (10/100 = .1 or 10%)
Value of a lead (taking figures from above):
Average website lead sale: $1,000
Conversion rate: 10%
Average lead value: ($1,000 X .1) = $100
ROAS:
$2,000 spend generated 100 leads
($2,000 / 100) = $20 cost per lead
If a lead is worth $100, this campaign generated $10,000 in value
Per lead, ROAS = $100/$20 = $5
Our hypothetical campaign above delivers 5:1 ROAS and this is what we would encourage you to set as your benchmark, however this number is not going to be right for all businesses, and it’s important to arrive at a set of numbers that reflects the right formula for your company.
Google Ads Benchmarks in summary
As much as we’d have loved to deliver a neat set of Google Ads Benchmarks in this post, hopefully we’ve gone one better and given you some ideas on how to produce your own figures that are far more relevant and reliable for your business. Here at Splendid Group, we’re absolutely committed to the process of benchmarking and measurement – so much so that we’ve developed a proprietary approach and our very own tool called Aperture. If you’d like to learn more about how we can help you, please get in touch.